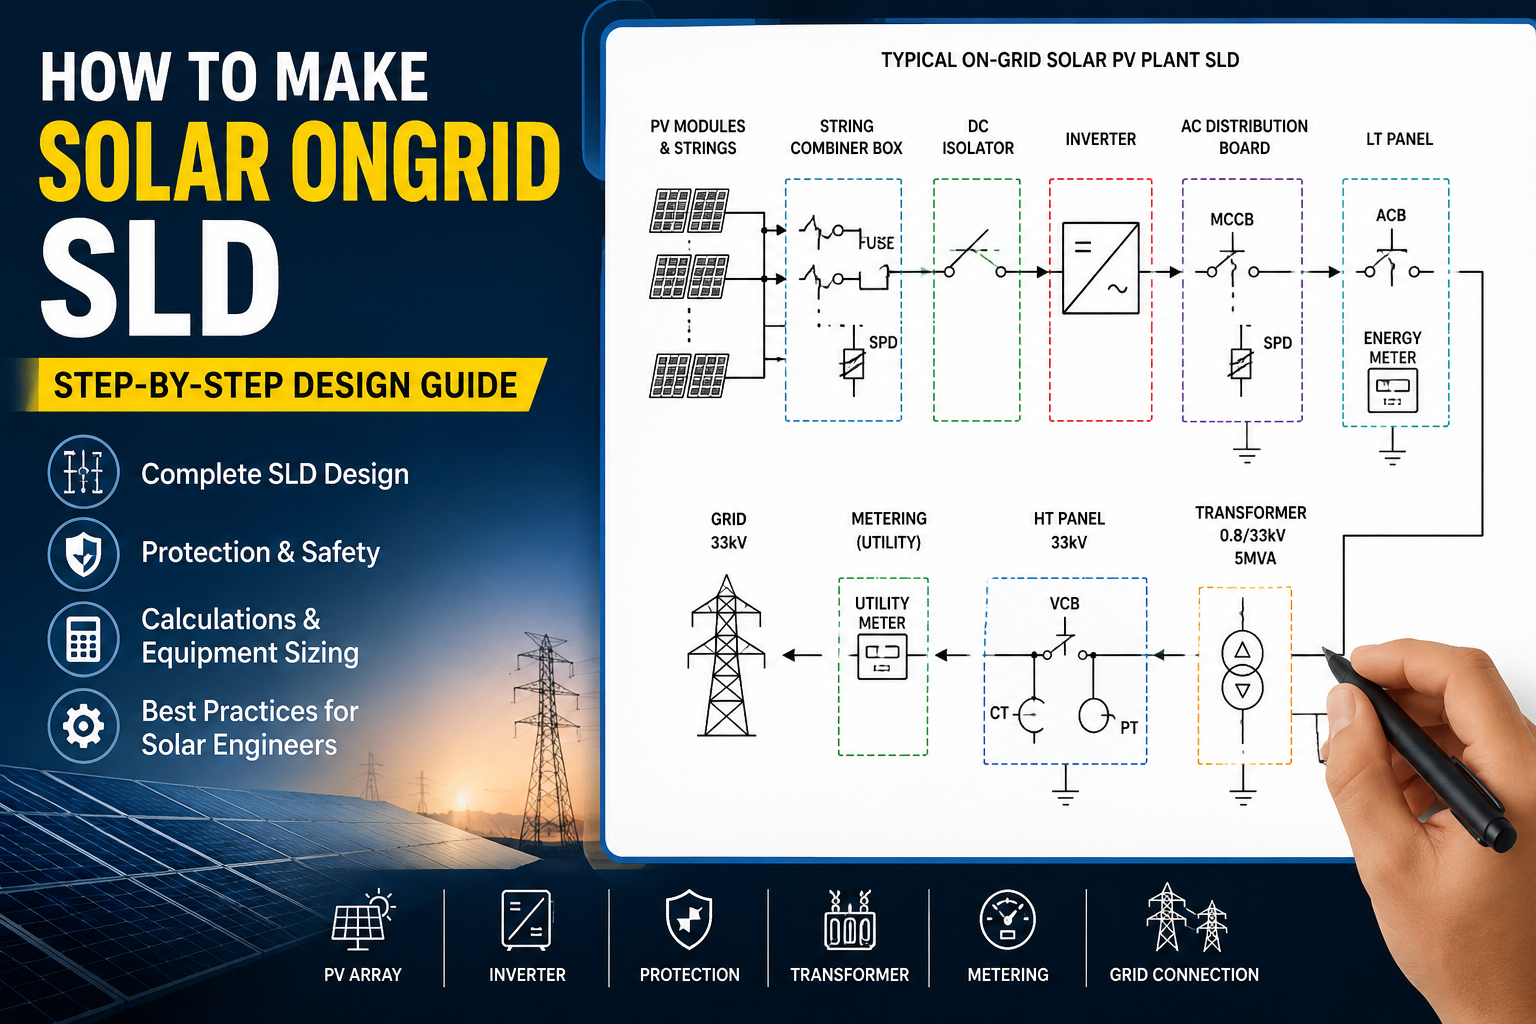
Solar On-Grid Single Line Diagram
A well-prepared Solar On-Grid Single Line Diagram helps engineers understand the complete electrical power flow from the PV array and inverter to the transformer, HT panel, metering system, and utility grid.
A Solar On-Grid Single Line Diagram (SLD) is one of the most important engineering drawings used in a grid-connected solar PV project. It provides a simplified representation of the complete electrical system, showing how power flows from the solar PV modules and inverters through transformers, protection equipment, metering systems, and the utility grid.
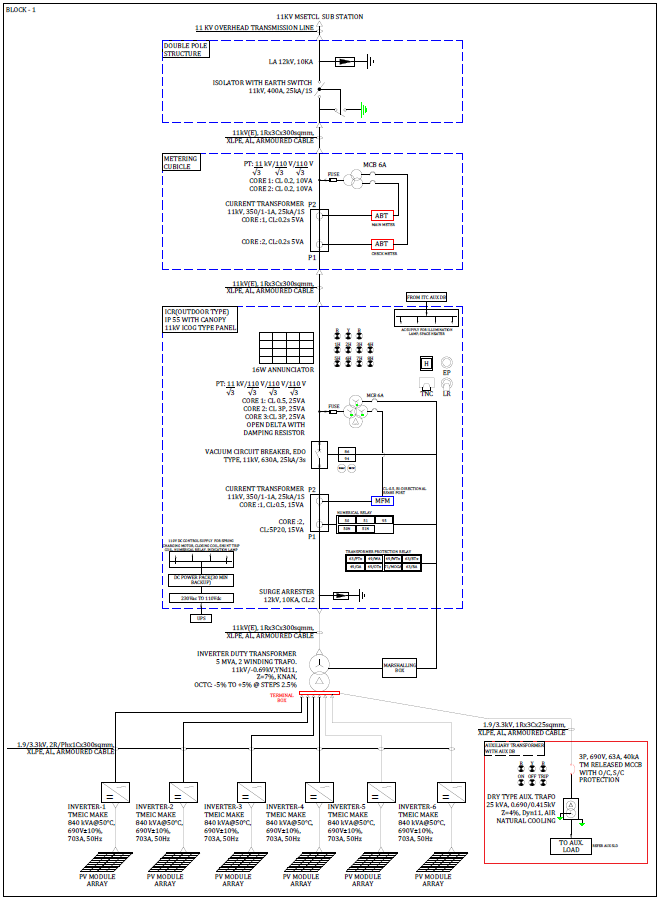
Whether you are designing a 10 kW rooftop solar plant or a 50 MW utility-scale solar project, the Single Line Diagram is the first document that electrical engineers, EPC contractors, and inspectors refer to throughout the project lifecycle.
This guide explains the complete process of preparing a professional solar on-grid Single Line Diagram, the symbols used, design methodology, calculations, and best engineering practices.
What is a Solar Single Line Diagram (SLD)?
A Solar Single Line Diagram is a simplified electrical drawing that illustrates how electrical power flows from the solar PV modules to the utility grid.Instead of drawing every individual conductor, a single line represents all three phases of the electrical system. This makes the drawing simple, readable, and suitable for engineering documentation.
A typical solar SLD includes:
PV Modules
String Configuration
String Combiner Boxes (SCB)
DC Isolators
Inverters
AC Distribution Panel
LT Panel
Transformer
HT Panel
Metering Arrangement
Protection Devices
Utility Grid Connection
The SLD also contains all major electrical ratings such as voltage, current, cable sizes, breaker ratings, transformer capacity, and equipment specifications.
Why is an SLD Important?
The Single Line Diagram serves multiple engineering purposes throughout the project.
It enables engineers to understand the complete electrical system without reviewing multiple drawings. It helps procurement teams identify equipment ratings, allows installers to perform correct wiring, assists commissioning engineers during testing, and provides utilities with sufficient information for grid approval.
Without a properly prepared SLD, electrical coordination, protection studies, and installation become extremely difficult.
Information Required Before Preparing an SLD
Before opening AutoCAD, engineers should collect all electrical design information.
This generally includes:
Installed DC Capacity
Export AC Capacity
Module Datasheet
Inverter Datasheet
Number of Modules
Number of Strings
Modules per String
Number of Inverters
Check DC/AC ratio
Transformer Rating
Grid Voltage
Earthing Arrangement
Metering Requirement
Utility Interconnection Voltage
Cable Sizes(AC/DC)
Breaker Ratings
Protection Philosophy
Once these details are available, the SLD can be prepared accurately.
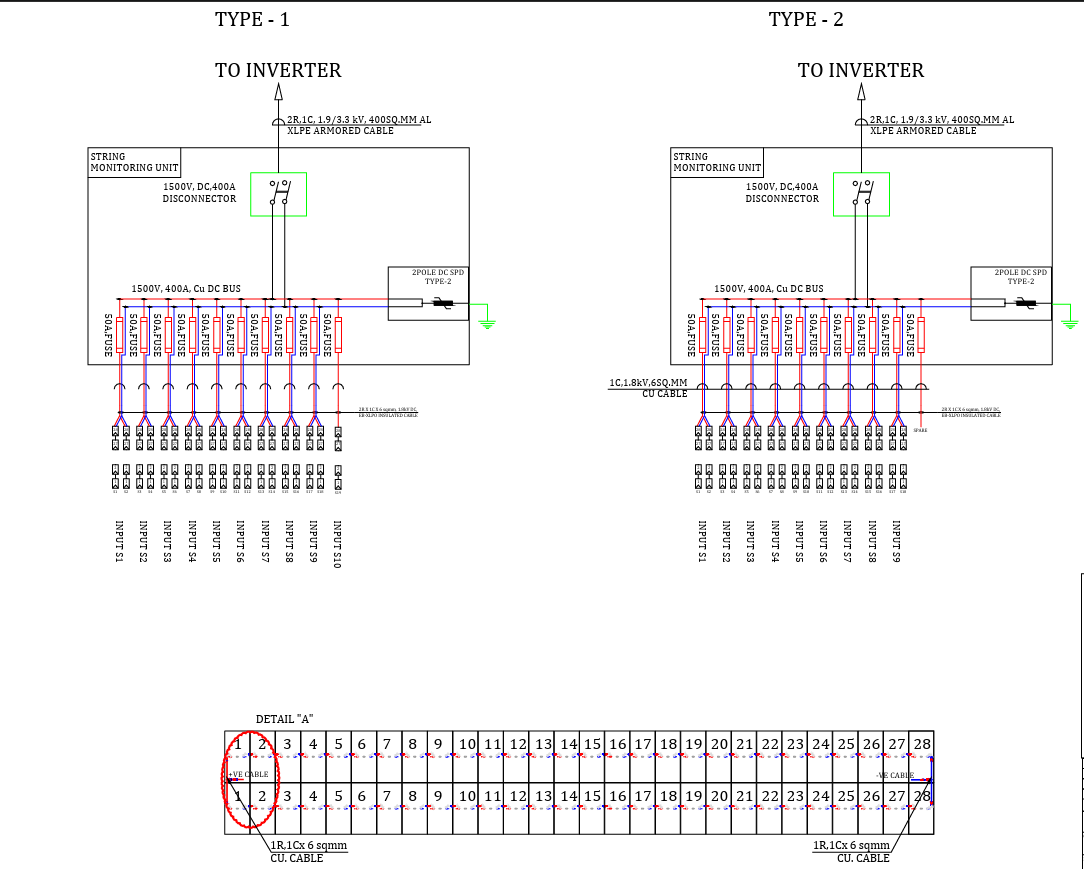
Step 1 – Draw the PV Array
The SLD always begins with the solar PV array.
Each string consists of several PV modules connected in series. Multiple strings are then connected to the inverter through combiner boxes or directly, depending on the inverter configuration.
For example, Module Rating = 590 W Modules per String = 28 Number of Strings = 20
Total DC Capacity becomes
PDC=590×28×20
PDC=330.4KW
This information is shown beside the PV array symbol.
Step 2 – Connect the String Combiner Box (SCB)
If SCBs are used, each string enters the combiner box through individual fuses.
The SCB normally contains:
String Fuse
SPD Monitoring (optional)
Output Isolator
The SLD should clearly indicate:
Number of Inputs
Output Current
Fuse Rating
SPD Type
Cable Size
Step 3 – Draw the DC Isolator
A DC isolator is installed between the PV array and inverter to safely disconnect the DC supply during maintenance.
The SLD should indicate: Voltage Rating
Current Rating
Number of Poles
IP Protection
Step 4 – Insert the Solar Inverter
he inverter converts DC power into AC power.
Mention the following information beside every inverter:
Rated Output Power
Input Voltage Range
MPPT Quantity
Maximum Input Current
AC Output Voltage Frequency
check MPPT
Output current
start voltage
Step 5 – AC Side Protection
The inverter output connects to an AC Distribution Board or LT Panel.
The following protection devices are generally shown:
MCCB
ACB
Isolator
SPD Energy Meter
Protection Relay
CT PT
Breaker selection depends on inverter output current.
Step 6 – LT Panel
The LT Panel combines multiple inverter outputs.
The SLD should indicate:
Incoming Feeders
Busbar Rating
Outgoing Feeders
Protection Relays
Metering
Cable Size
Step 7 – Transformer
The transformer steps up the voltage from inverter output to grid voltage.
Example:
800 V / 33 kV
Capacity = 5 MVA
Mention: Vector Group Cooling Type Impedance
Tap Changer
Neutral Earthing
Step 8 – HT Panel
The HT Panel generally contains:
Vacuum Circuit Breaker
CT
PT
Numerical Relay
Surge Arrester
Isolator
Protection
The HT panel receives 33 kV power from the transformer and delivers it to the utility feeder after passing through protection and metering equipment.
Step 9 – Utility Metering
The utility section generally contains:
Main Meter
Check Meter ABT Meter (Utility Scale) Import/Export MeterFinally, the plant connects to the utility grid.
Click below for how to Design a 1 MW Ground-Mounted Solar Power Plant
Conclusion;
A well-designed Solar On-Grid Single Line Diagram is much more than a drawing—it is the electrical blueprint of the entire PV plant. It defines how power flows from the solar modules to the utility grid while documenting all major equipment, protection devices, metering arrangements, and electrical ratings. By following a structured design process and validating every component against project calculations and standards, engineers can create SLDs that are accurate, easy to interpret, and ready for installation, commissioning, and utility approval.